
ARAGÓN ARTACHO, Francisco J., et al.[1] presents new ways to visualize large mathematical datasets. In particular, the paper goes into determining if a real number is "Normal" through visualizations.
”A real constant α is b-normal if, given the positive integer b ≥ 2, every m-long string of base-b digits appears in the base-b expansion of α with precisely the expected limiting frequency 1/bm."
The paper shows a visualization of many base 4 numbers. The authors also go on to suggest applying this visualization technique to genome comparisons.
[1] ARAGÓN ARTACHO, Francisco J., et al. "Walking on real numbers". The Mathematical Intelligencer. Vol. 35, Issue 1 (March 2013). ISSN 0343-6993, pp. 42-60
Visualization
A walk for a base 4 number consists of steps where at each step the path moves one unit east, north, west or south, depending on the whether the
number at that position is 0, 1, 2 or 3.
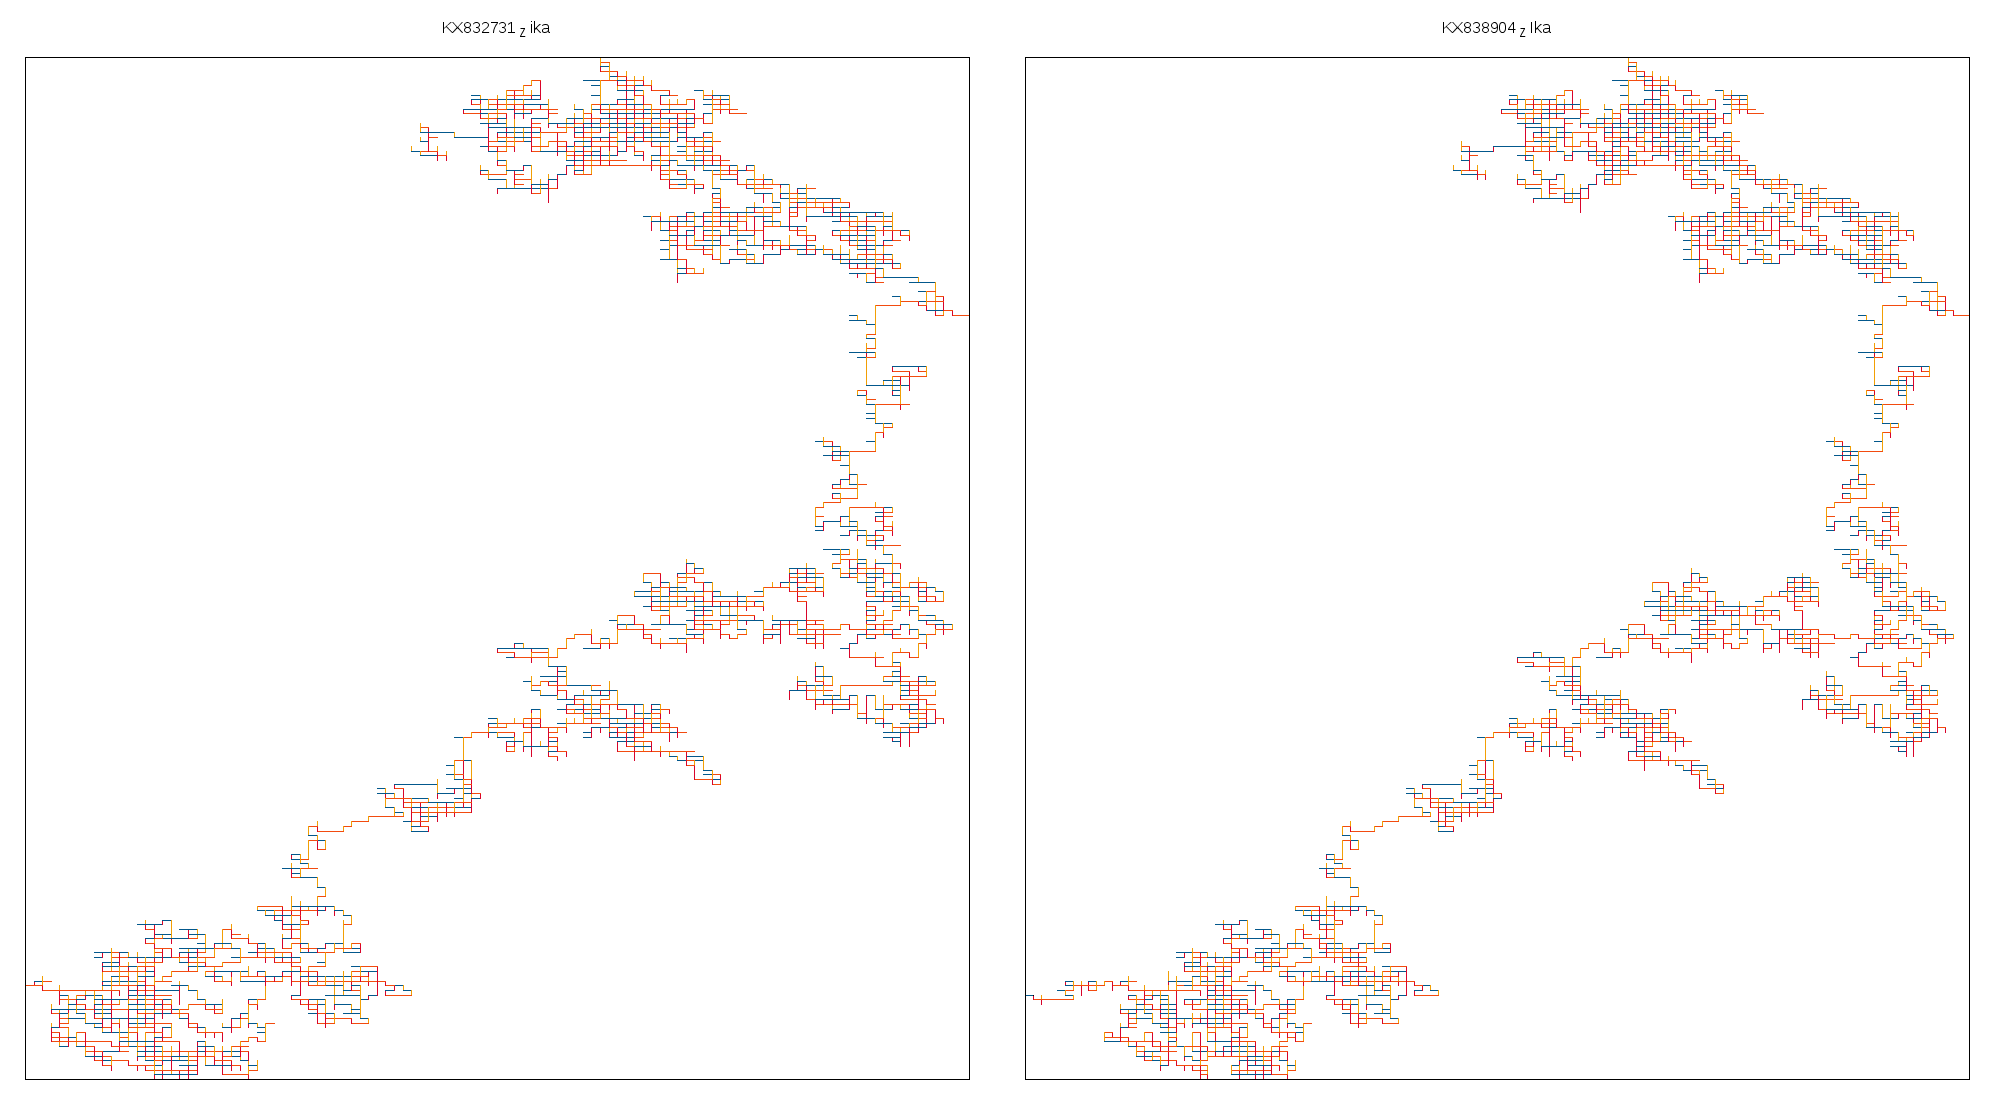
I've applied this visualization technique to DNA. DNA consists of 4 nucleotides denoted by A, T, G and C. For each of these nucleotides, I assigned a direction to the step - North, East, South, and West respectively.
Instead of the HSV color scheme used in the paper, that generates a spectrum of colors from VIBGYOR, I've used fixed colors for each nucleotide to get an idea of the nucleotide content in the sequence which is of value in sequence analysis.
Color Scheme
- A - #D9042B
- T - #03588C
- G - #F29F05
- C - #F24B0F
I picked up the color scheme from Adobe Color.
Data Sources
- GenBank - Sequences posted by Nathan Grubaugh.
- Human Genome build hg19(GRCh37) from Ensembl
Thanks to
All the folks at the Andersen Lab.
For More Data ...
At the Andersen Lab we are sequencing Zika virus in samples from humans and mosquitoes in Florida, USA. We're regularly releasing data available here.
Code at Github
Nucleotide Walk Potraits
I've uploaded all the images shown below [here](https://drive.google.com/drive/folders/0B0sPnwAkyGDMa1RRQWh3TGtKUk0?usp=sharing).Fig 1 shows strains of Zika virus from humans and mosquitoes in Florida, USA sequenced at the Andersen Lab. Fig 2 shows a few flaviruses - Chaoyang Virus, Culiseta Virus, Powassan Virus and West Nile Virus. Notice how both the figures capture the difference in mutations.

Fig 1: Strains of Zika virus from GenBank.
Clockwise:
- Zika virus isolate from Aedes_aegypti. USA. 2016
- Zika virus isolate from Aedes_aegypti. USA. 2016
- Zika virus isolate from Human. USA. 2016
- Zika virus isolate from Human. USA. 2016

Fig 2: A few Flaviviruses from GenBank
Clockwise:
- Chaoyang virus strain ROK144
- Culiseta flavivirus strain
- Powassan virus strain P0375
- West Nile virus isolate FtC-3699
Human chromosome walks
Images of human chromosomes show very similar A,T,G and C content(except for Chr22 and Chr19). I'm looking into producing gigapixel images to allow zooming to make the walks clearer.
Disclaimer: I'm quite busy with my work at the lab so it will be a while before I can get around to doing it.
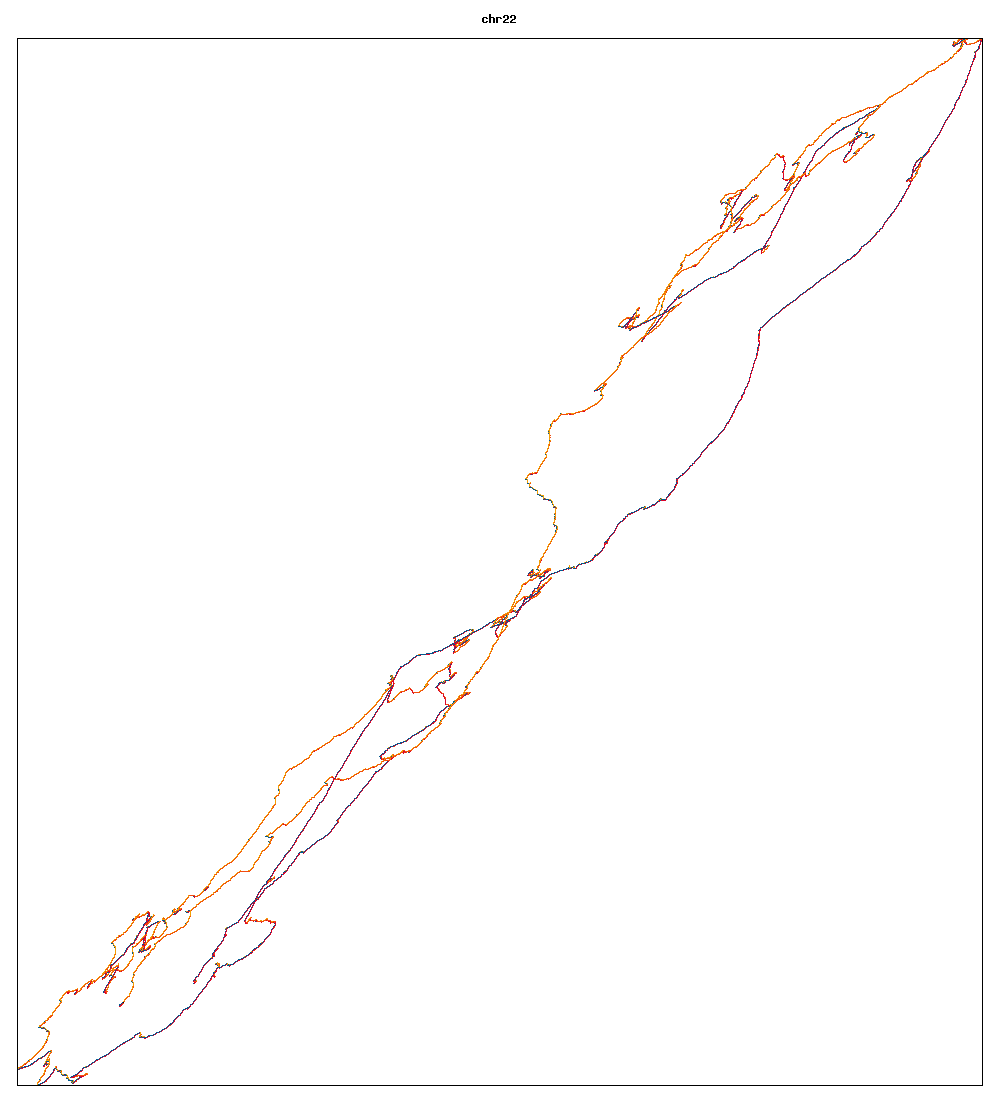
Fig3a: Chromosome 22
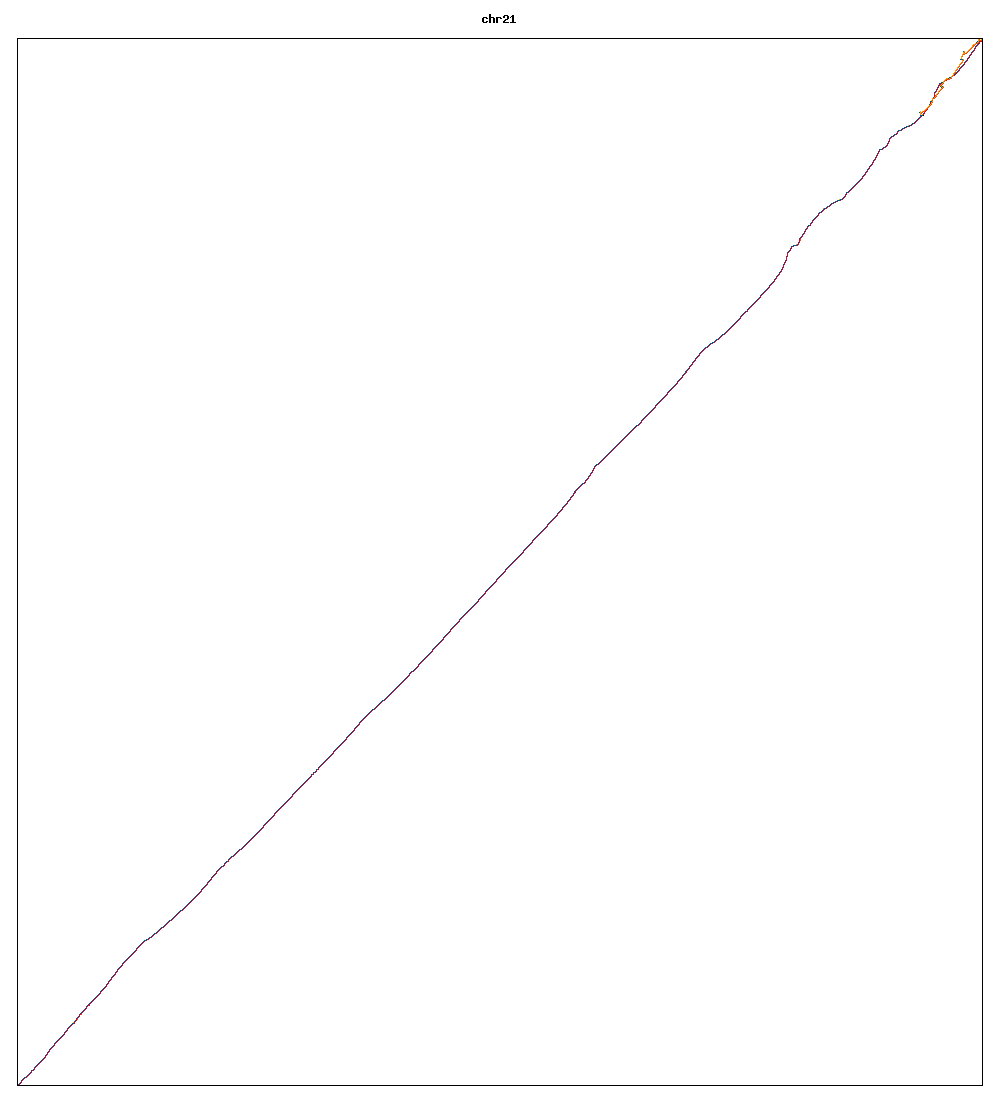
Fig3b: Chromosome 21

Fig3c: Chromosome 20

Fig3d: Chromosome 19

Fig3e: Chromosome 18
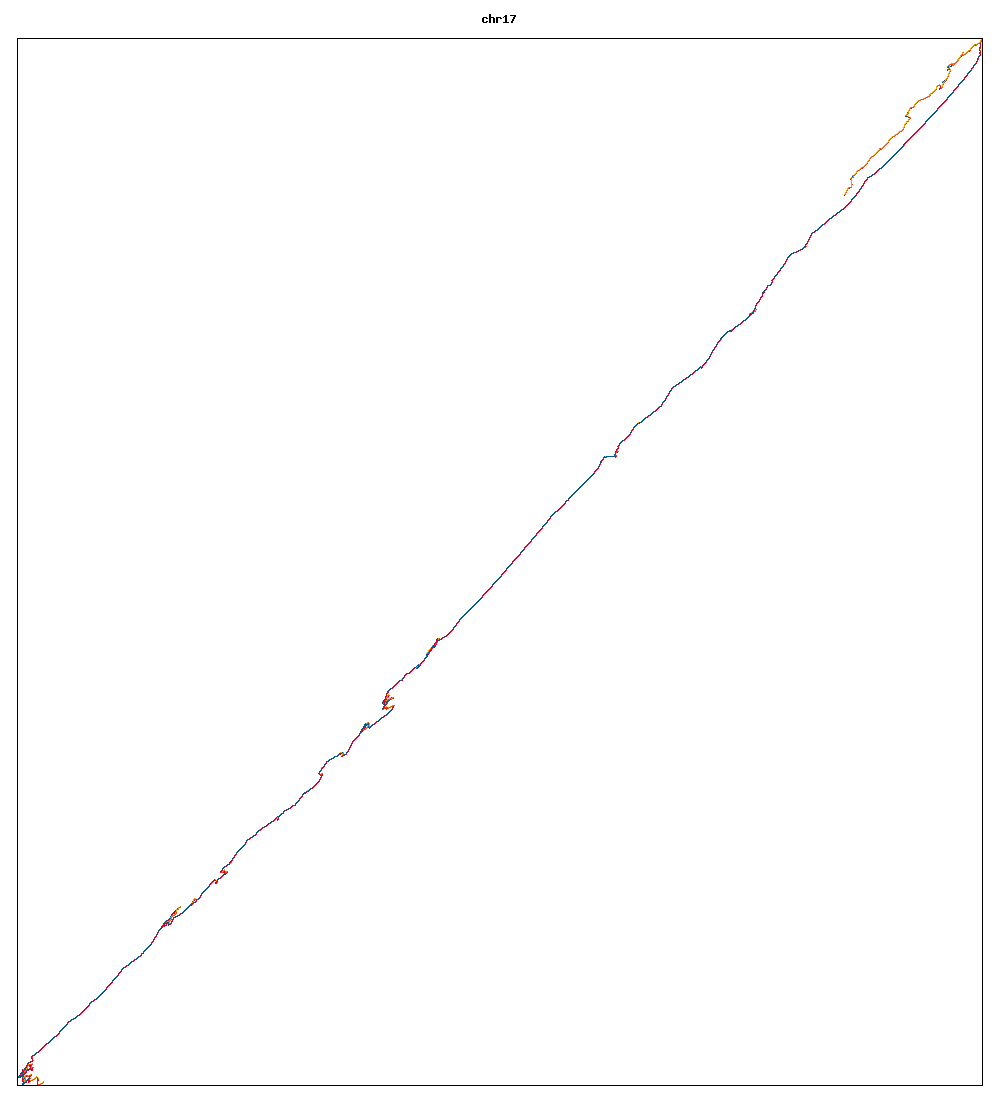
Fig3f: Chromosome 17
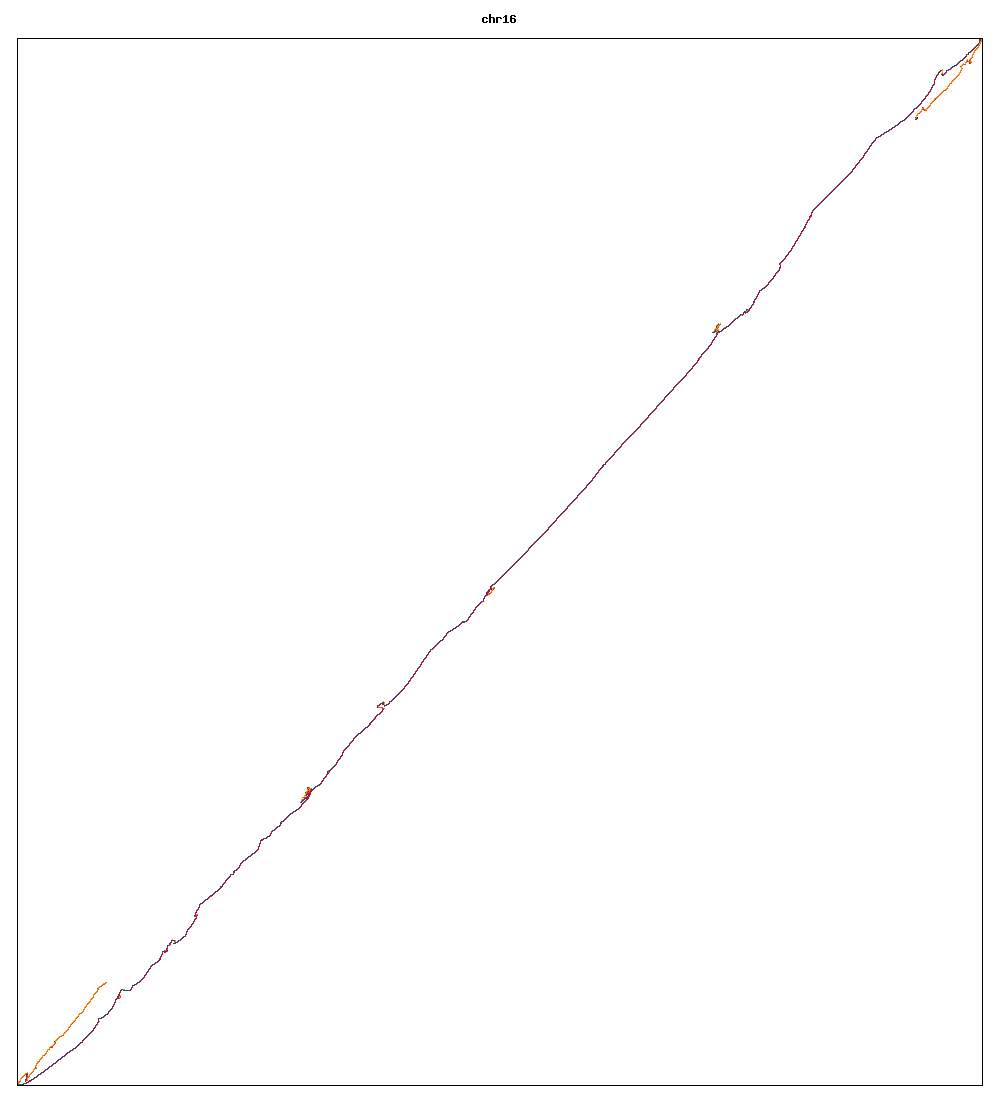
Fig3g: Chromosome 16

Fig3h: Chromosome 15

Fig3i: Chromosome 14
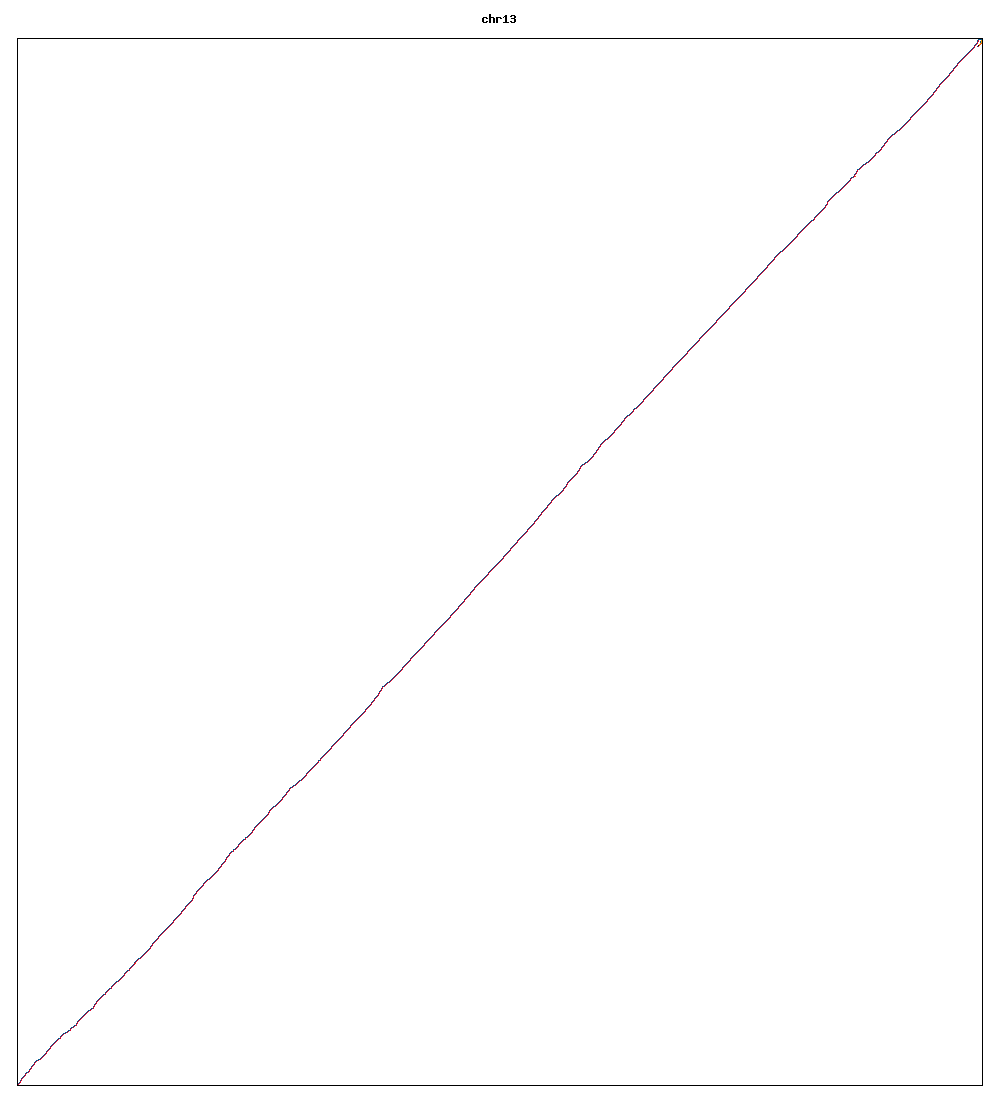
Fig3j: Chromosome 13

Fig3k: Chromosome 12

Fig3l: Chromosome 11
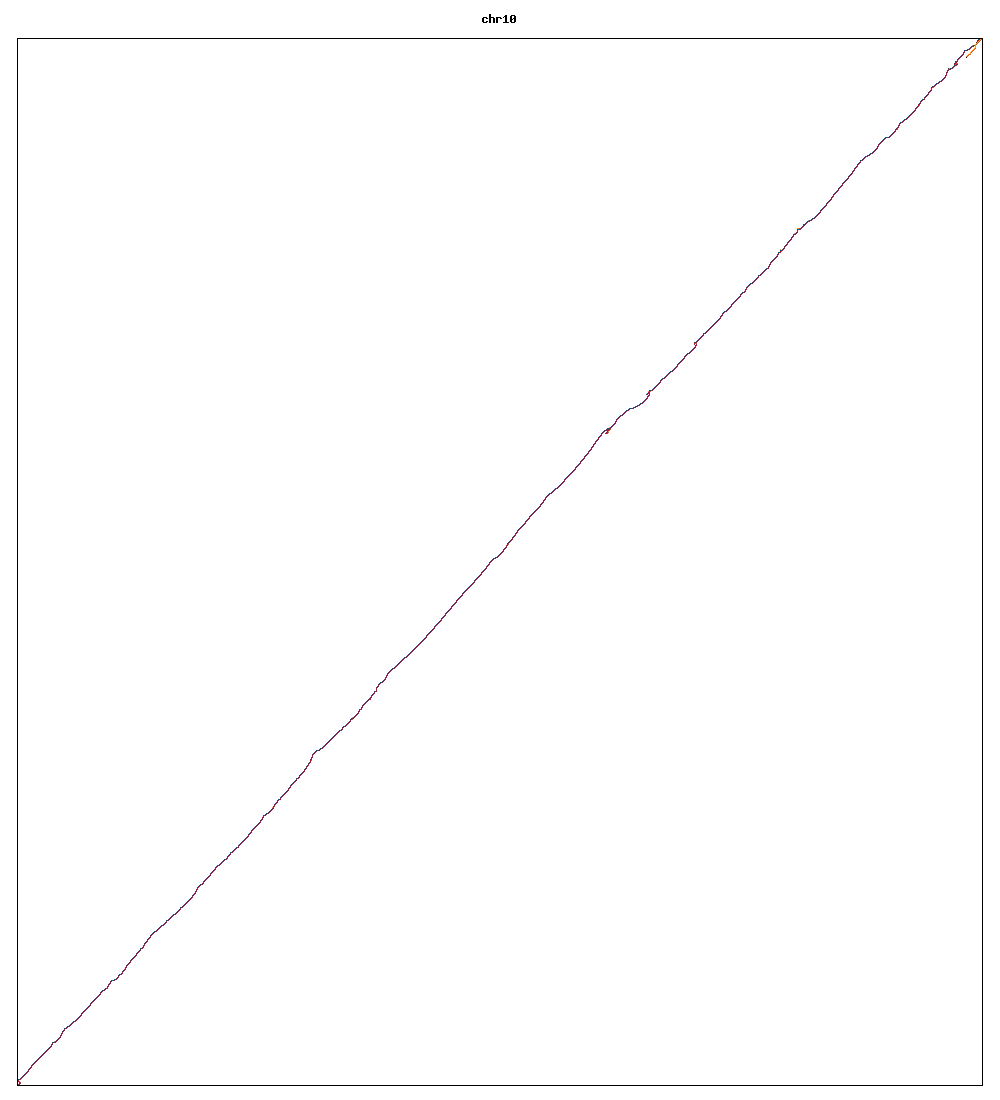
Fig3m: Chromosome 10

Fig3n: Chromosome 9
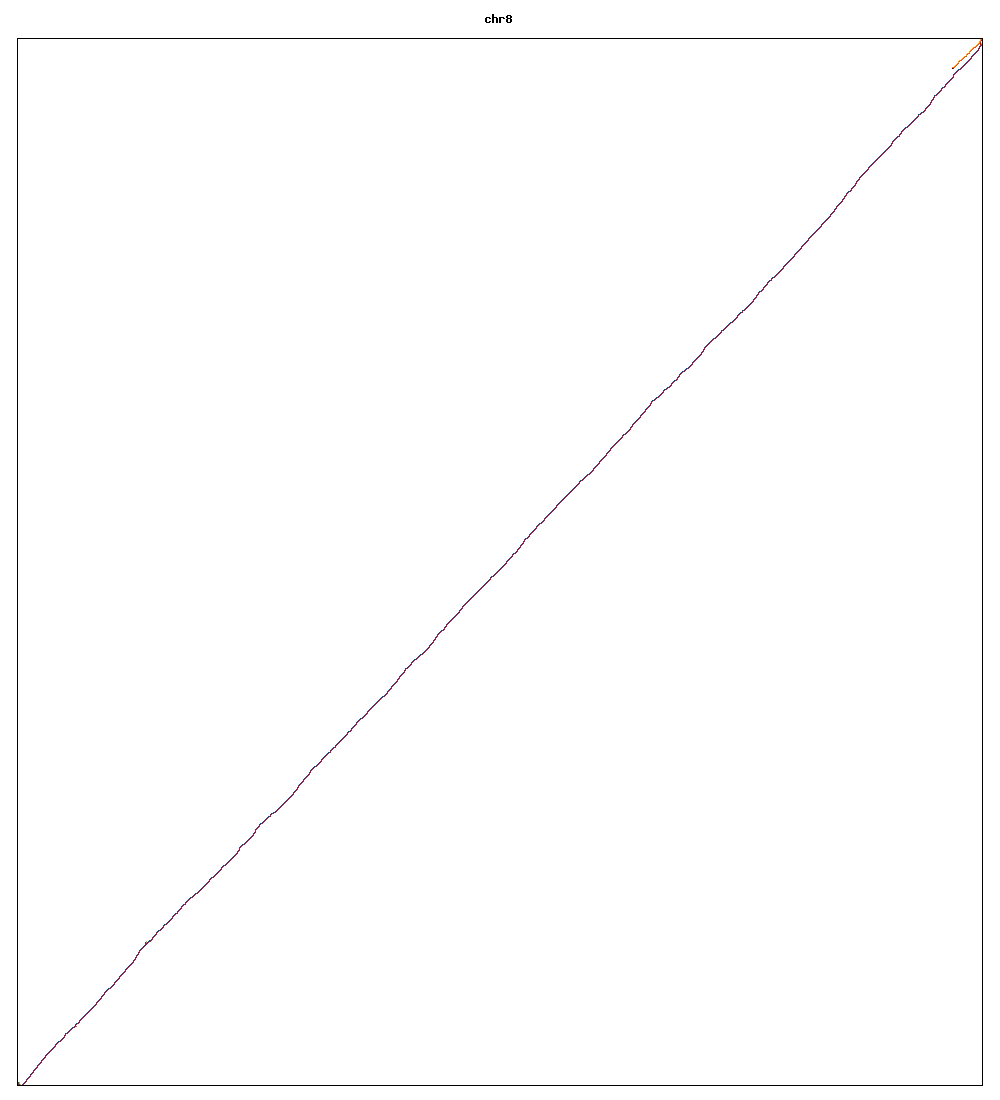
Fig3o: Chromosome 8

Fig3p: Chromosome 7

Fig3q: Chromosome 6

Fig3r: Chromosome 5

Fig3s: Chromosome 4

Fig3t: Chromosome 3
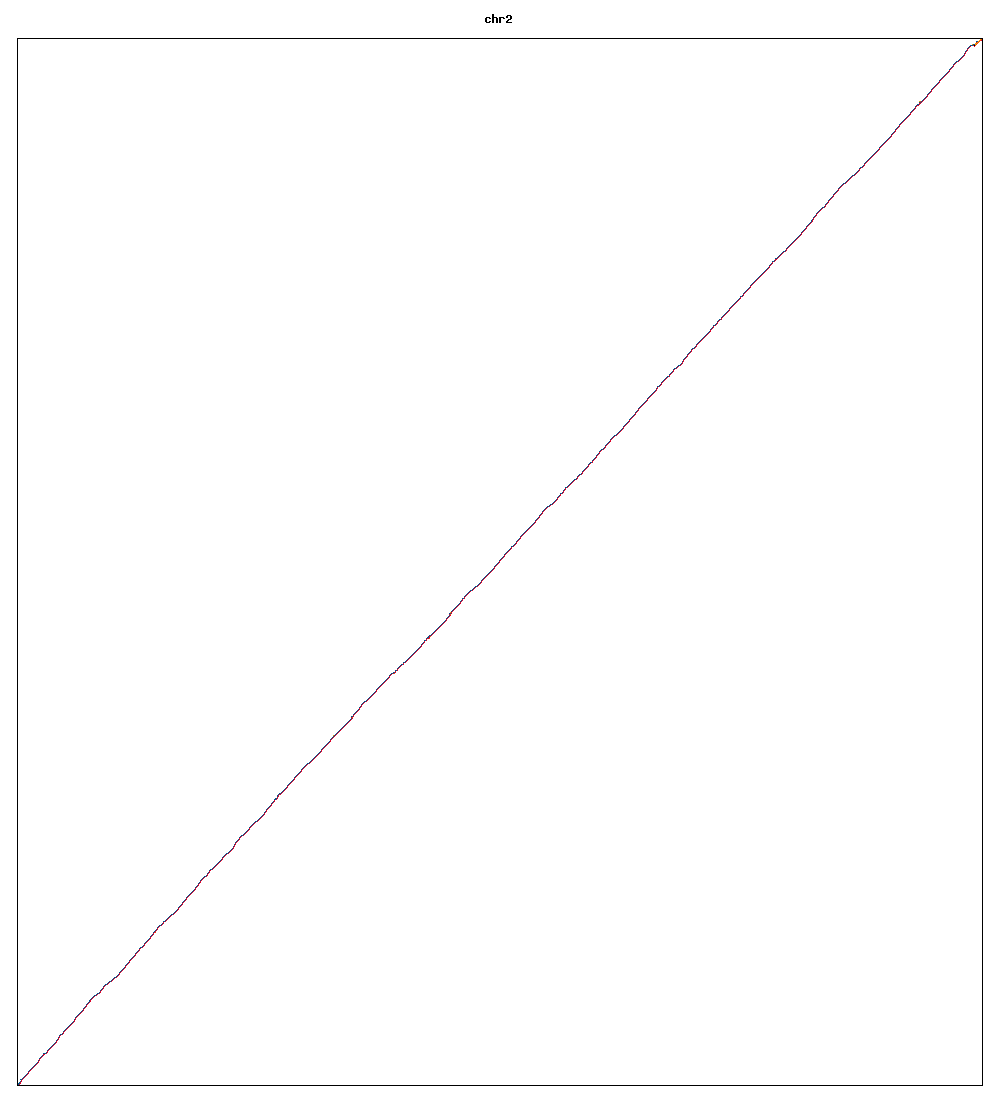
Fig3u: Chromosome 2

Fig3v: Chromosome 1
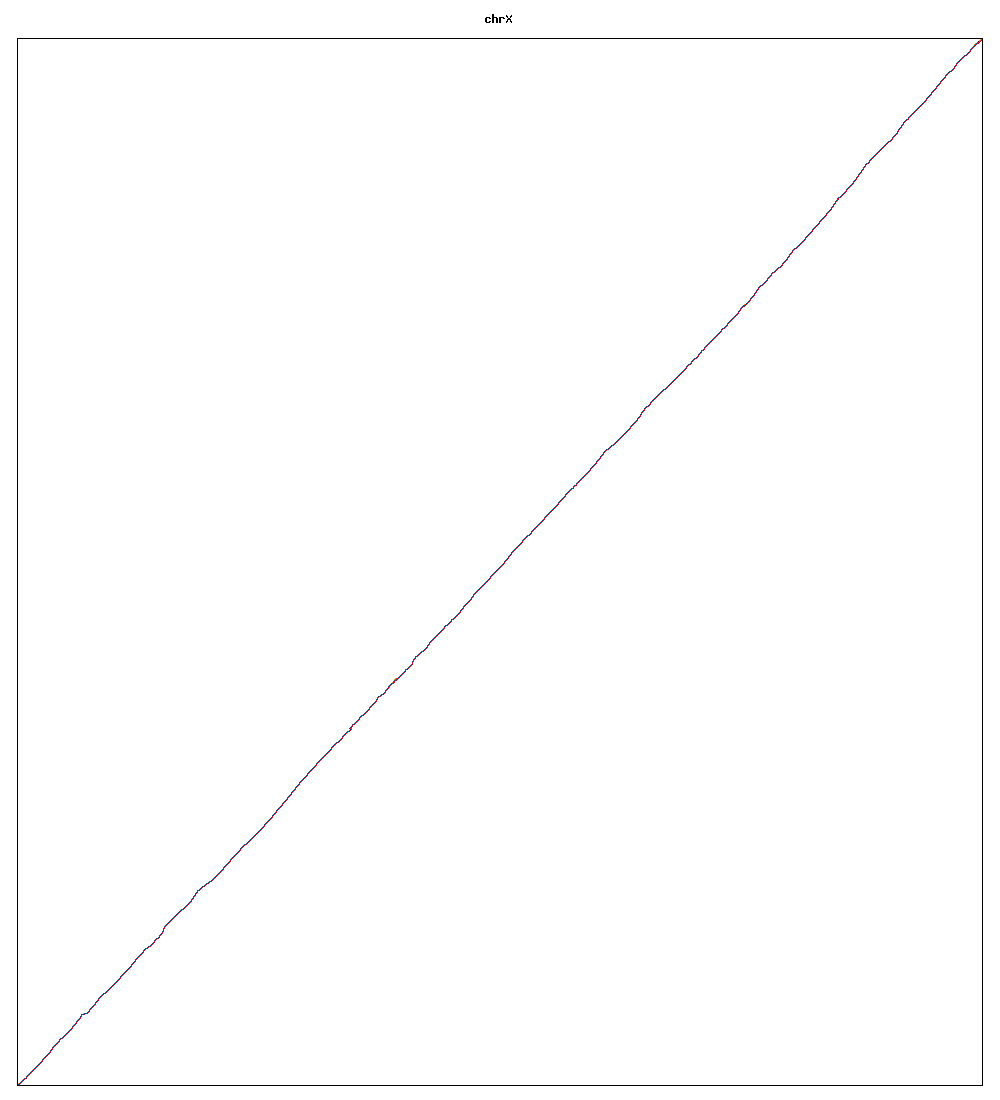
Fig3w: Chromosome X
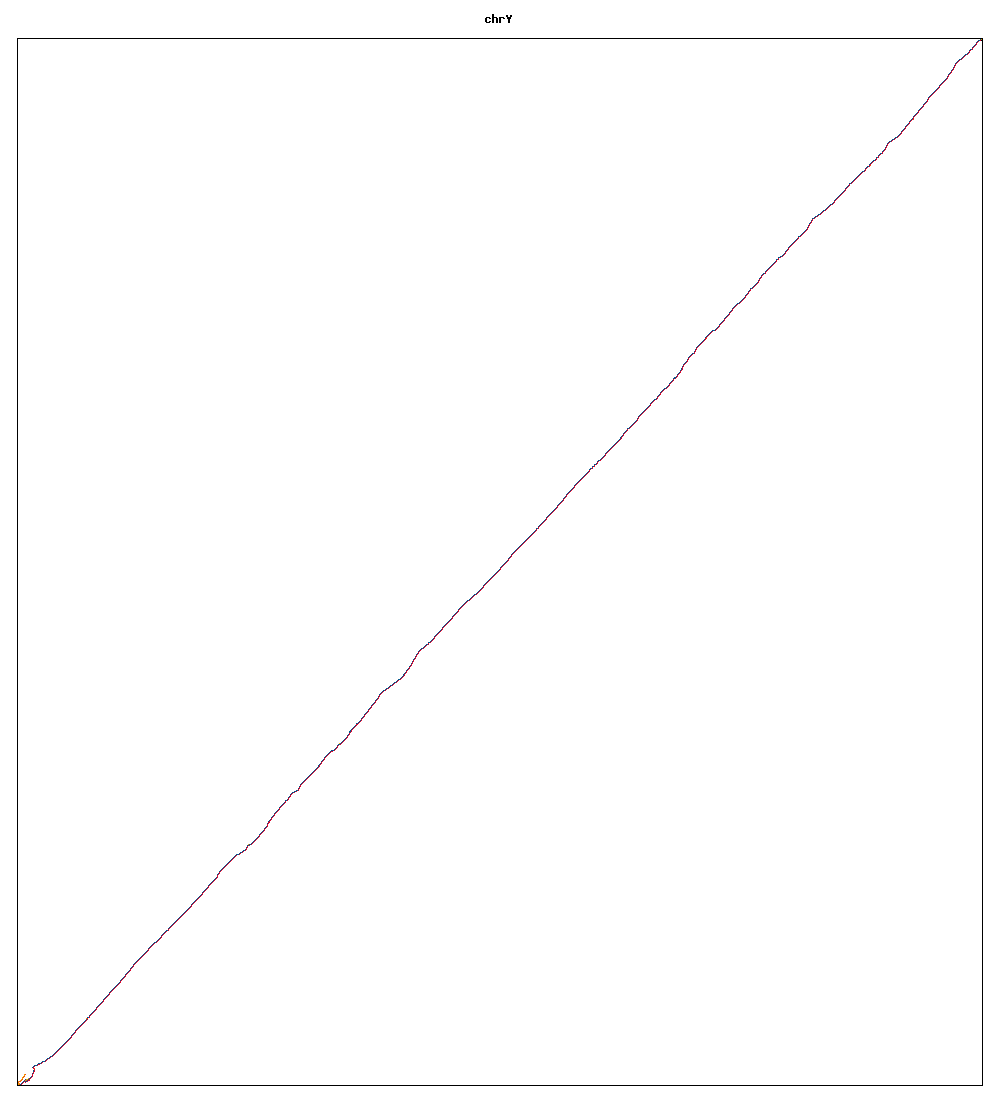
Fig3x: Chromosome Y